HOUSING SUPPLY OVERVIEW
September marks the beginning of everything in the Twin Cities cooling down. With the kids back in school and the temperatures dropping, the housing marketing starts its annual cool down as well. Nationally, buyer and seller activity remained strong, buoyed by low mortgage rates and a strong economy. The Twin Cities real estate market fundamentals suggest no significant changes from recent trends, other than the seasonally tempered pace we see this time of year.
As we move into the final three months of 2019, home buyers will find fewer homes coming on the market, but also less competition for those homes that are.
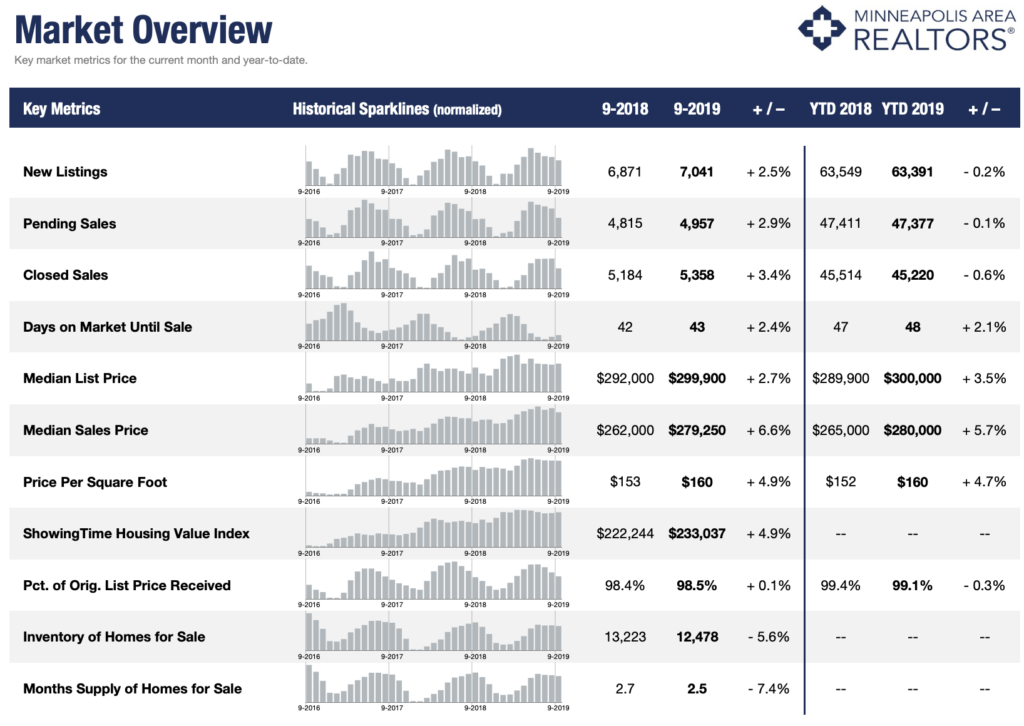
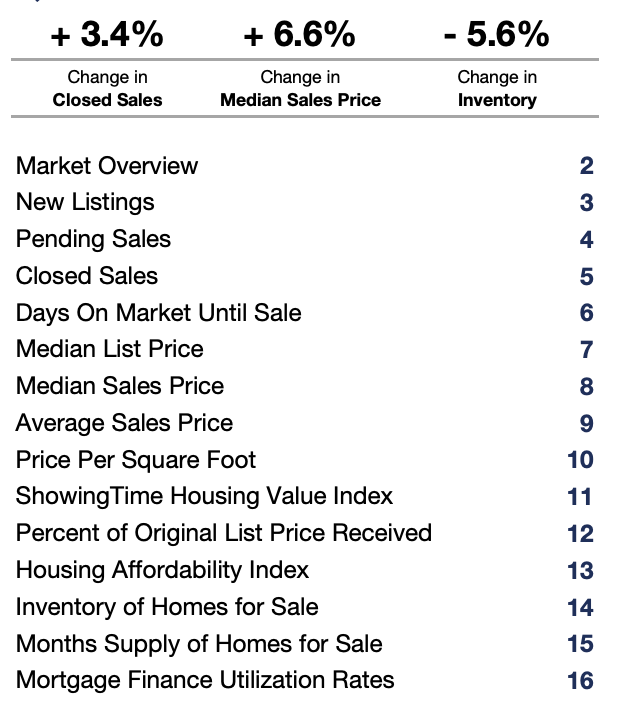
Minneapolis Area Realtors reports that New Listings in the Twin Cities region increased 2.5 percent to 7,041. Pending Sales were up 2.9 percent to 4,957. Inventory levels fell 5.6 percent to 12,478 units. Prices continued to gain traction. The Median Sales Price increased 6.6 percent to $279,250. Days on Market was up 2.4 percent to 43 days. Sellers were encouraged as Months Supply of Homes for Sale was down 7.4 percent to 2.5 months.
QUICK FACTS
WHERE YOU LIVE
John Wanninger represents home buyers and sellers throughout Minnesota. He is an industry veteran selling real estate in Edina, Minneapolis, Minnetonka, and other areas surrounding the Twin Cities. Here’s a look at the real estate market indicators for where you live in Minnesota.
TWIN CITIES REAL ESTATE MARKET INSIGHTS
September 2019 Twin Cities real estate market update (monthly)
The following data compares Twin Cities real estate market insights from September 2018 and September 2019. Inventory fell 4.7% in September 2019. New listings increased 2.8% and pending sales increased 3.6%, netting in a decline in the supply of homes for sale in the Twin Cities region. Although there was a shortage of inventory, closed sales increased 3.9% in September 2019.
In September 2019, there were 5,387 closed sales in the Twin Cities region, which showed a +3.9% increase from the 5,184 available in September of 2018. Days on the market before accepting an offer decreased by 2 days in September 2019 while the percent of list price received increased slightly to 98.5%. It still isn’t time for home buyers to expect much in price negotiations. Median sales price increased 6.5% to $279,000 in the Twin Cities region.
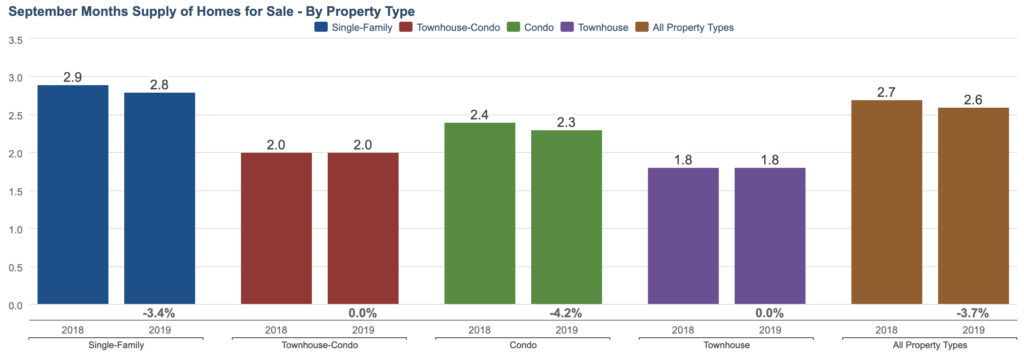
Months supply of inventory in September 2019 dropped 3.7%, meaning it’s still a seller’s market. The property type with the highest supply is single family homes. Townhouses continue to be in the shortest supply in the Twin Cities real estate market.
All data from NorthstarMLS. InfoSparks © 2019 Showing Time.
| September | 2018 | 2019 | + / – |
| New Listings | 6,871 | 7,065 | +2.8% |
| Pending Sales | 4,815 | 4,989 | +3.6% |
| Closed Sales | 5,184 | 5,387 | +3.9% |
| Median Sales Price* | $262,000 | $279,000 | +6.5% |
| Average Sales Price* | $305,093 | $328,361 | +7.6% |
| Price Per Square Foot* | $153 | $160 | +4.6% |
| Percent of Original List Price Received* | 98.4% | 98.5% | +0.1% |
| Days on Market Until Sale | 24 | 22 | -8.3% |
| Inventory of Homes for Sale | 13,222 | 12,597 | -4.7% |
| Months Supply of Inventory | 2.7 | 2.6 | -3.7% |
The figures and numbers above are based on statistics for the Twin Cities real estate market released by NorthStarMLS. All data points are one month of activity.
September 2019 Twin Cities real estate market update (rolling 12 months)
In terms of rolling 12 months, here are the Twin Cities real estate market insights. There was a +1.3% increase in new listings in the Twin Cities. In 2018 there were 74,913, meanwhile in 2019, there were 75,865. There were 59,362 closed sales in the Twin Cities in 2018, which saw a 0.6% decrease in 2019 to 59,027 closed sales. The median sales price increased 6.6% and the average sales price increased 5.7% in 2019. As a result, the price per square foot saw a 5.8% increase from $139 in 2018 to $147 in 2019. The percent of original list price received saw a slight 0.2% decrease, moving from 98.9% in 2018 to 98.7% in 2019.
| Rolling 12 Months | 2018 | 2019 | + / – |
| New Listings | 74,913 | 75,865 | +1.3% |
| Closed Sales | 59,362 | 59,027 | -0.6% |
| Median Sales Price* | $260,000 | $277,100 | +6.6% |
| Average Sales Price* | $307,425 | $325,096 | +5.7% |
| Price Per Square Foot* | $139 | $147 | +5.8% |
| Percent of Original List Price Received* | 98.9% | 98.7% | -0.2% |
| Days on Market Until Sale | 23 | 23 | 0.0% |
| Inventory of Homes for Sale | 10,579 | 11,034 | +4.3% |
| Months Supply of Inventory | 2.1 | 2.3 | +9.5% |
The figures and numbers above are based on statistics for the Twin Cities real estate market released by NorthStarMLS. All data points are 12 months of activity.
EDINA REAL ESTATE MARKET INSIGHTS
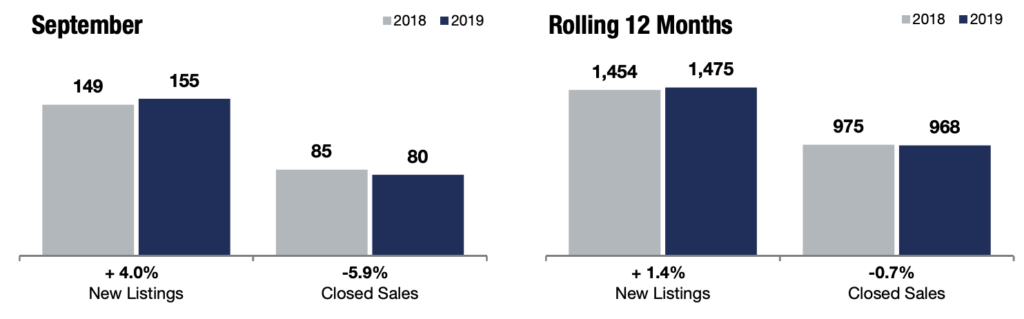
The local market update in Edina for September 2019 showed an increase in almost all areas. There was a +4.0% change in new listings, a -5.9% change in closed sales, and +23.2% change in median sales price.
September 2019 Edina real estate market update (monthly)
The following compares Edina real estate market insights from September 2018 and September 2019. In 2019, there were 155 new listings in Edina. This was a +4.0% increase from September 2018, when there were 149 new listings. Meanwhile, there was a -5.9% change in closed sales. There were 80 closed sales in September 2019 and 85 in September 2018. Furthermore, the median sales price increased +23.2% from $430,000 to $529,950 in September 2019. The average sales price also saw an increase. The average sales price changed +21.2% from $557,747 to $675,771. As a result, the price per square foot increased +12.7% from $203 to $229.
Furthermore, the percent of original list price received changed +1.1% from 94.7% in September 2018 to 95.7% in September 2019. The days on market until sale decreased -31.0%, going from 87 to 60. Inventory of homes for sale also declined from 351 to 321. Finally, the months supply of inventory decreased -11.4% from 4.4 to 3.9 in September 2019. It’s important to note that these numbers do not account for seller concessions.
*Graph taken from Minneapolis Area Realtors.
| September | 2018 | 2019 | + / – |
| New Listings | 149 | 155 | +4.0% |
| Closed Sales | 85 | 80 | -5.9% |
| Median Sales Price* | $430,000 | $529,950 | +23.2% |
| Average Sales Price* | $557,747 | $675,771 | +21.2% |
| Price Per Square Foot* | $203 | $229 | +12.7% |
| Percent of Original List Price Received* | 94.7% | 95.7% | +1.1% |
| Days on Market Until Sale | 87 | 60 | -31.0% |
| Inventory of Homes for Sale | 351 | 321 | +8.5% |
| Months Supply of Inventory | 4.4 | 3.9 | -11.4% |
The data above comes from the Minneapolis Area Realtors Local Market Update – September 2019. All data in this report comes from NorthstarMLS.
September 2019 Edina real estate market update (rolling 12 months)
In terms of rolling 12 months, here are the Edina real estate market insights. There was a +1.4% increase in new listings in Edina. In 2018 there were 1,454, meanwhile in 2019, there were 1,475. There were 975 closed sales in Edina in 2018, and 968 in 2019.
The median sales price in 2019 also increased +3.1% from $450,000 to $461,167. Similarly, the average sales price increased +4.8% from $545,691 in 2018 to $572,024 in 2019. As a result, the price per square foot increased +4.9% from $200 in 2018 to $210 in 2019. The percent of original list price received saw a slight decrease of -0.3%, moving from 96.6% in 2018 to 96.3% in 2019. Finally, the days on market until sale increased +4.2%, moving from 71 in 2018 to 74 in 2019.
| Rolling 12 Months | 2018 | 2019 | + / – |
| New Listings | 1,454 | 1,475 | +1.4% |
| Closed Sales | 975 | 968 | -0.7% |
| Median Sales Price* | $450,000 | $464,167 | +3.1% |
| Average Sales Price* | $545,691 | $572,024 | +4.8% |
| Price Per Square Foot* | $200 | $210 | +4.9% |
| Percent of Original List Price Received* | 96.6% | 96.3% | -0.3% |
| Days on Market Until Sale | 71 | 74 | +4.2% |
| Inventory of Homes for Sale | – | – | – |
| Months Supply of Inventory | – | – | – |
The data above comes from the Minneapolis Area Realtors Local Market Update – September 2019. All data in this report comes from NorthstarMLS.
MINNEAPOLIS LOCAL MARKET UPDATE
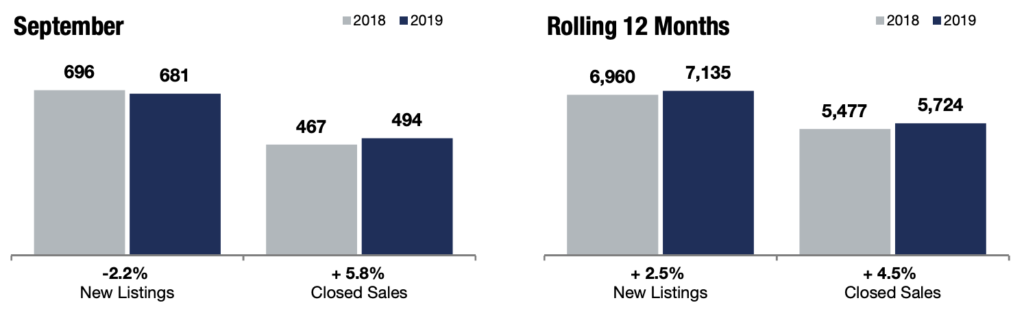
The local market update in Minneapolis for September 2019 showed several key real estate market insights. There was a -2.2% change in new listings, a+5.8% change in closed sales, and +7.3% change in median sales price.
September 2019 Minneapolis real estate market update (monthly)
The following compares Minneapolis real estate market insights from September 2018 and September 2019. In September 2018, there were 696 new listings in Minneapolis. Meanwhile, in August 2019 there were 681, demonstrating a -2.2% change. Coincidentally, the number of closed sales increased from 467 to 494 in September 2019.
Moreover, the median sales price for Minneapolis real estate increased +7.3% from $260,000 to $279,000. Likewise, the average sales price increased +8.2% from $313,345 to $339,068. In addition, the price per square foot increased +1.3% from $208 to $211 in September 2019. The percent of original list price received saw a -0.3% change, dropping from from 99.5% to 99.2%. Furthermore, the days on market until sale also declined from 39 to 37, a -5.1% change. The inventory of homes for sale decreased -7.0% from 1,110 to 1,032 in September 2019. Finally, the months supply of inventory decreased -8.3% from 2.4 to 2.2.
*Graph taken from Minneapolis Area Realtors.
| September | 2018 | 2019 | + / – |
| New Listings | 696 | 681 | -2.2% |
| Closed Sales | 467 | 494 | +5.8% |
| Median Sales Price* | $260,000 | $279,000 | +7.3% |
| Average Sales Price* | $313,345 | $339,068 | +8.2% |
| Price Per Square Foot* | $208 | $211 | +1.3% |
| Percent of Original List Price Received* | 99.5% | 99.2% | -0.3% |
| Days on Market Until Sale | 39 | 37 | -5.1% |
| Inventory of Homes for Sale | 1,110 | 1,032 | -7.0% |
| Months Supply of Inventory | 2.4 | 2.2 | -8.3% |
The data above comes from the Minneapolis Area Realtors Local Market Update – September 2019. All data in this report comes from NorthstarMLS.
September 2019 Minneapolis real estate market update (rolling 12 months)
In terms of rolling 12 months, here are the Minneapolis real estate market insights. There was a +2.5% increase in new listings in Minneapolis. In 2018 there were 6,960, meanwhile in 2019, there were 7,135. There were 5,477 closed sales in Minneapolis in 2018 and 5,724 in 2019, a +4.5% change. Moreover, the median sales price in 2019 increased +8.2% from $257,000 to $278,000. The average sales price also so a +8.2% change. In 2018 the average sales price was $315,116, whereas it was $340,938 in 2019. As a result, the price per square foot saw a +7.2% change, going from $201 to $216. Furthermore, the percent of original list price received saw a slight -0.3% decrease, moving from 99.6% in 2018 to 99.3% in 2019. Finally, the days on market until sale increased +7.3%, moving from 41 in 2018 to 44 in 2019.
| September | 2018 | 2019 | + / – |
| New Listings | 6,960 | 7,135 | +2.5% |
| Closed Sales | 5,477 | 5,724 | +4.5% |
| Median Sales Price* | $257,000 | $278,000 | +8.2% |
| Average Sales Price* | $315,116 | $340,938 | +8.2% |
| Price Per Square Foot* | $201 | $216 | +7.2% |
| Percent of Original List Price Received* | 99.6% | 99.3% | -0.3% |
| Days on Market Until Sale | 41 | 44 | +4.2% |
| Inventory of Homes for Sale | – | – | – |
| Months Supply of Inventory | – | – | – |
The data above comes from the Minneapolis Area Realtors Local Market Update – September 2019. All data in this report comes from NorthstarMLS.
MINNETONKA REAL ESTATE MARKET INSIGHTS
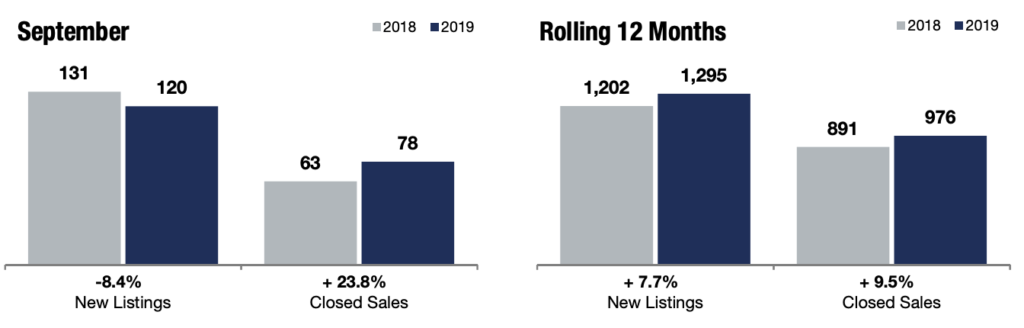
The local market update in Minnetonka for September 2019 showed several key real estate market insights. There was a -8.4% change in new listings, a +23.8% change in closed sales, and -1.8% change in median sales price.
September 2019 Minnetonka real estate market update (monthly)
The following compares Minnetonka real estate market insights from September 2018 and September 2019. In September 2018, there were 131 new listings in Minnetonka. This number decreased -8.4% in September 2019 to 120 new listings. Coincidentally, there was a +23.8% increase in closed sales. In September 2018, there were 63 closed sales, while in September 2019 there were 78. Unlike Edina and Minneapolis, the median sales price for Minnetonka real estate decreased -1.8%. In September 2018, it was $363,000, whereas, in September 2019, it was $356,500. However, the average sales price increased +1.7% from $410,815 to $417,622.
The price per square foot in Minnetonka saw a +1.6% change, increasing from $167 to $170 in September 2019. The percent of original list price received saw a -1.0% change, moving from 98.0% to 97.0%. As such, the days on market increased +3.9% from 51 days to 53 days. However, the inventory of homes for sale decreased -11.7% from 264 homes in September 2018 to 233 homes in September 2019. Finally, the months supply of inventory in Minnetonka dropped -20.0% from 3.5 to 2.8.
*Graph taken from Minneapolis Area Realtors.
| September | 2018 | 2019 | + / – |
| New Listings | 131 | 120 | -8.4% |
| Closed Sales | 63 | 78 | +23.8% |
| Median Sales Price* | $363,000 | $356,500 | -1.8% |
| Average Sales Price* | $410,815 | $417,622 | +1.7% |
| Price Per Square Foot* | $167 | $170 | +1.6% |
| Percent of Original List Price Received* | 98.0% | 97.0% | -1.0% |
| Days on Market Until Sale | 51 | 53 | +3.9% |
| Inventory of Homes for Sale | 264 | 233 | -11.7% |
| Months Supply of Inventory | 3.5 | 2.8 | -20.0% |
The data above comes from the Minneapolis Area Realtors Local Market Update – September 2019. All data in this report comes from NorthstarMLS.
September 2019 Minnetonka real estate market update (rolling 12 months)
In terms of rolling 12 months, the Minnetonka real estate market insights are as follows. There was an +7.7% increase in new listings in Minnetonka. In 2018 there were 1,202, meanwhile in 2019, there were 1,295. There were 891 closed sales in Minnetonka in 2018, which presented a +9.5% increase with 976 closed sales in 2019. The median sales price in 2019 also increased slightly (+2.9%) from $340,000 to $350,000. Similarly, the average sales price increased +1.8% from $404,020 in 2018 to $411,267 in 2019. As a result, the price per square foot saw a +3.4% increase, moving from $168 in 2018 to $174 in 2019. The percent of original list price received saw a minor -0.3% decrease, moving from 97.7% in 2018 to 97.4% in 2019. Finally, the days on market until sale decreased -3.4%, moving from 59 in 2018 to 57 in 2019.
| Rolling 12 Months | 2018 | 2019 | + / – |
| New Listings | 1,202 | 1,295 | +7.7% |
| Closed Sales | 891 | 976 | +9.5% |
| Median Sales Price* | $340,000 | $350,000 | +2.9% |
| Average Sales Price* | $404,020 | $411,267 | +1.8% |
| Price Per Square Foot* | $168 | $174 | +3.4% |
| Percent of Original List Price Received* | 97.7% | 97.4% | -0.3% |
| Days on Market Until Sale | 59 | 57 | -3.4% |
| Inventory of Homes for Sale | – | – | – |
| Months Supply of Inventory | – | – | – |
VIEW THE FULL REPORTS
Specializing in luxury properties and condominiums, John T. Wanninger is a professional in Minneapolis real estate. John Wanninger leads the JTW Partners group at Lakes Sotheby’s International Realty.
To view all available listings and properties in Edina and the Twin Cities metro area, CLICK HERE.
Follow John Wanninger’s social media! Stay up to date with his Instagram and Facebook.
Contact John to set up an appointment or list your house for sale in Edina, Minneapolis, or greater Twin Cities area today.