HOUSING SUPPLY OVERVIEW
The US Federal Reserve lowered benchmark interest rate for the first time in a decade. As a result, mortgage rates have dropped down, approaching historically low levels that the real estate market hasn’t seen since 2016. Luxury homes with sales prices of $1,000,0001 and above saw the largest gain. This showed a +14.9% increase. The overall median sales price rose +6.2% to $275,000. Moreover, the property type with the largest price gain was the condominium market. Prices increased +11.3% to $184,700. The price range that tended to sell the quickest was the $190,001 to $250,000 range at 35 days. Meanwhile, the price range that tended to sell the slowest was the $1,000,001 and above range at 160 days. Overall, inventory levels market-wide were down -5.5%.
WHERE YOU LIVE
John Wanninger represents home buyers and sellers throughout Minnesota. He is an industry veteran selling real estate in Edina, Minneapolis, Minnetonka, and other areas surrounding the Twin Cities. Here’s a look at the real estate market indicators where you live in Minnesota.
EDINA REAL ESTATE MARKET INSIGHTS
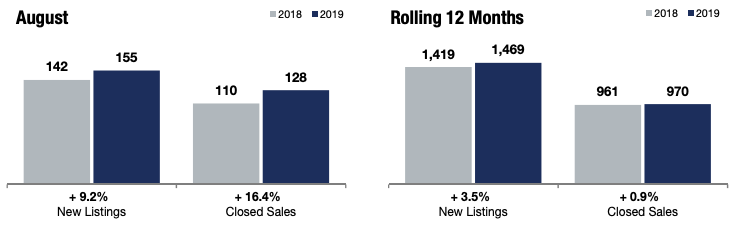
The local market update in Edina for August 2019 showed an increase in almost all areas. There was a +9.2% change in new listings, a +16.4% change in closed sales, and +12.5% change in median sales price.
The following compares Edina real estate market insights from August 2018 and August 2019. In 2019, there were 155 new listings in Edina. This was a +9.2% increase from August 2018, which had 142 new listings. The biggest change that occurred between August 2018 and August 2019 was the +16.4% increase of closed sales. There were 128 closed sales in August 2019 and 110 in August 2018. The median sales price increased +12.5% from $442,000 to $497,200 in August 2019. Meanwhile, the average sales price increased +11.9% from $555,943 to $622,184. As a result, the price per square foot increased +2.9% from $213 to $219.
Furthermore, the percent of original list price received decreased -1.3% from 98.0% in August 2018 to 96.7% in August 2019. Although the days on market increased +7.1% from 56 days in August 2018 to 60 days in August 2019, the inventory of homes for sales decreased -12.6% from 341 to 298. Finally, the months supply of inventory decreased -14.0% from 4.3 to 3.7 in August 2019. It’s important to note that these numbers do not account for seller concessions.
*Graph taken from Minneapolis Area Realtors.
In terms of rolling 12 months, here are the Edina real estate market insights. There was a +3.5% increase in new listings in Edina. In 2018 there were 1,419, meanwhile in 2019, there were 1,469. There were 961 closed sales in Edina in 2018, which saw a +0.9% increase in 2019 at 970 closed sales. The median sales price in 2019 also increased +2.2% from $450,000 to $460,000. Similarly, the average sales price increased +3.8% from $541,430 in 2018 to $562,126 in 2019. As a result, the price per square foot saw a +3.3% increase from $201 in 2018 to $208 in 2019. The percent of original list price received saw a slight -0.6% decrease, going from 96.8% in 2018 to 96.2% in 2019. Finally, the days on market until sale increased +11.6%, moving from 69 in 2018 to 77 in 2019.
MINNEAPOLIS LOCAL MARKET UPDATE
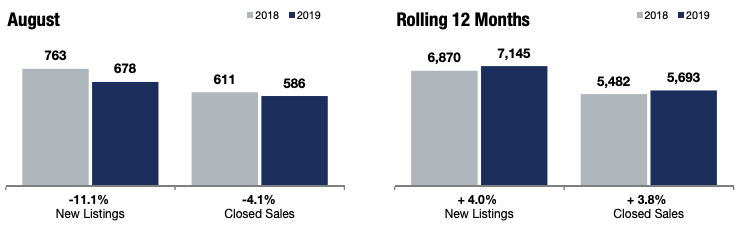
The local market update in Minneapolis for August 2019 showed several key real estate market insights. There was a -11.1% change in new listings, a -4.1% change in closed sales, and +5.6% change in median sales price.
The following compares Minneapolis real estate market insights from August 2018 and August 2019. There was a large change between 2018 and 2019 was the amount of new listings. In August 2018, there were 763 new listings in Minneapolis. Meanwhile, in August 2019 there were 678, demonstrating a -11.1% decrease. As a result, the number of closed sales decreased -4.1%. In August 2018, there were 611 closed sales, while there were only 586 in August 2019.
Coincidentally, the median sales price for Minneapolis real estate increased +5.6% from $270,000 to $285,000. Likewise, the average sales price increased +3.2% from $332,511 to $343,161. In addition, the price per square foot increased +2.1% from $213 to $218 in August 2019. The percent of original list price received saw a -0.9% decrease from 100.0% to 99.1%. The days on market until sale showed a slight increase of +2.9% from 35 days to 36 days. The inventory of homes for sale decreased -10.9% from 1,059 to 944 in August 2019. Finally, the months supply of inventory decreased -13.0% from 2.3 to 2.0.
*Graph taken from Minneapolis Area Realtors.
In terms of rolling 12 months, here are the Minneapolis real estate market insights. There was a +4.0% increase in new listings in Minneapolis. In 2018 there were 6,870, meanwhile in 2019, there were 7,145. There were 5,482 closed sales in Minneapolis in 2018, which presented a +3.8% increase in 2019 at 5,693 closed sales. The median sales price in 2019 also increased +8.2% from $255,000 to $276,000. Similarly, the average sales price increased +7.9% from $313,914 in 2018 to $338,868 in 2019. As a result, the price per square foot saw a +7.9% increase from $200 in 2018 to $216 in 2019. The percent of original list price received saw a slight -0.2% decrease, moving from 99.5% in 2018 to 99.3% in 2019. Finally, the days on market until sale increased +7.3%, moving from 41 in 2018 to 44 in 2019.
MINNETONKA REAL ESTATE MARKET INSIGHTS
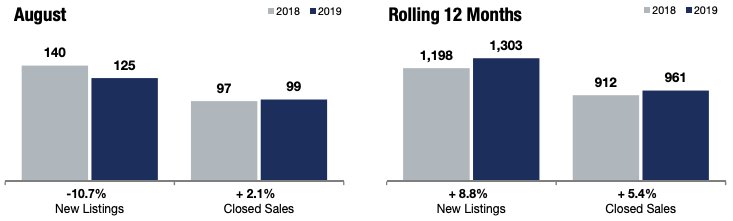
The local market update in Minnetonka for August 2019 showed several key real estate market insights. There was a -10.7% change in new listings, a +2.1% change in closed sales, and -2.7% change in median sales price.
The following compares Minnetonka real estate market insights from August 2018 and August 2019. In August 2018, there were 140 new listings in Minnetonka. This number decreased -10.7% in August 2019 to 125 new listings. Coincidentally, there was a +2.1% increase in closed sales. In August 2018, there were 97 closed sales, while in August 2019 there were 99. Unlike Edina and Minneapolis, the median sales price for Minnetonka real estate decreased -2.7%. In August 2018, it was $337,000, whereas, in August 2019, it was $328,000. As a result, the average sales price decreased -7.0% from $402,930 to $374,633.
The price per square foot in Minnetonka dropped -4.0% from $178 to $171 in August 2019. The percent of original list price received saw a slight +0.3% increase, going from 97.8% to 98.1%. The biggest change between August 2018 and August 2019 was the number of days on market until sale. This decreased -24.4% from 45 days to 34 days. In addition, the inventory of homes for sale decreased -10.3%, with 243 in August 2018 to 218 in August 2019. Finally, the months supply of inventory in Minnetonka dropped -18.2% from 3.3 to 2.7.
*Graph taken from Minneapolis Area Realtors.
In terms of rolling 12 months, the Minnetonka real estate market insights are as follows. There was an +8.8% increase in new listings in Minnetonka. In 2018 there were 1,198, meanwhile in 2019, there were 1,303. There were 912 closed sales in Minnetonka in 2018, which presented a +5.4% increase with 961 closed sales in 2019. The median sales price in 2019 also increased slightly (+2.9%) from $340,000 to $350,000. Similarly, the average sales price increased +2.8% from $399,600 in 2018 to $410,717 in 2019. As a result, the price per square foot saw a +3.9% increase from $167 in 2018 to $174 in 2019. The percent of original list price received saw a minor -0.1% decrease, moving from 97.6% in 2018 to 97.5% in 2019. Finally, the days on market until sale decreased -3.4%, moving from 59 in 2018 to 57 in 2019.
Specializing in luxury properties and condominiums, John T. Wanninger is a professional in Minneapolis real estate. John Wanninger leads the JTW Partners group at Lakes Sotheby’s International Realty.
To view all available listings and properties in Edina and the Twin Cities metro area, CLICK HERE.
Follow John Wanninger’s social media! Stay up to date with his Instagram and Facebook.
Contact John to set up an appointment or list your house for sale in Edina, Minneapolis, or greater Twin Cities area today.